Why I Develop Polarion Mostly with VS Code
As a Polarion developer I moved from the classic Eclipse + Notepad++ combo to a VS Code–first setup. I share my daily workflow, how I debug Polarion today, and why AI tools like Copilot and ChatGPT are at the core of it.


In this post I want to show how I work as a Polarion developer, why my setup is moving more and more towards “VS Code only”, and where the current limits are – especially when it comes to debugging Java code.
If you develop for Polarion, work with Java, Velocity, and web technologies, and are considering VS Code as your main environment, you should find some concrete ideas and experiences here.
What Do I Actually Need for Polarion Development?
For Polarion development I mainly need four building blocks:
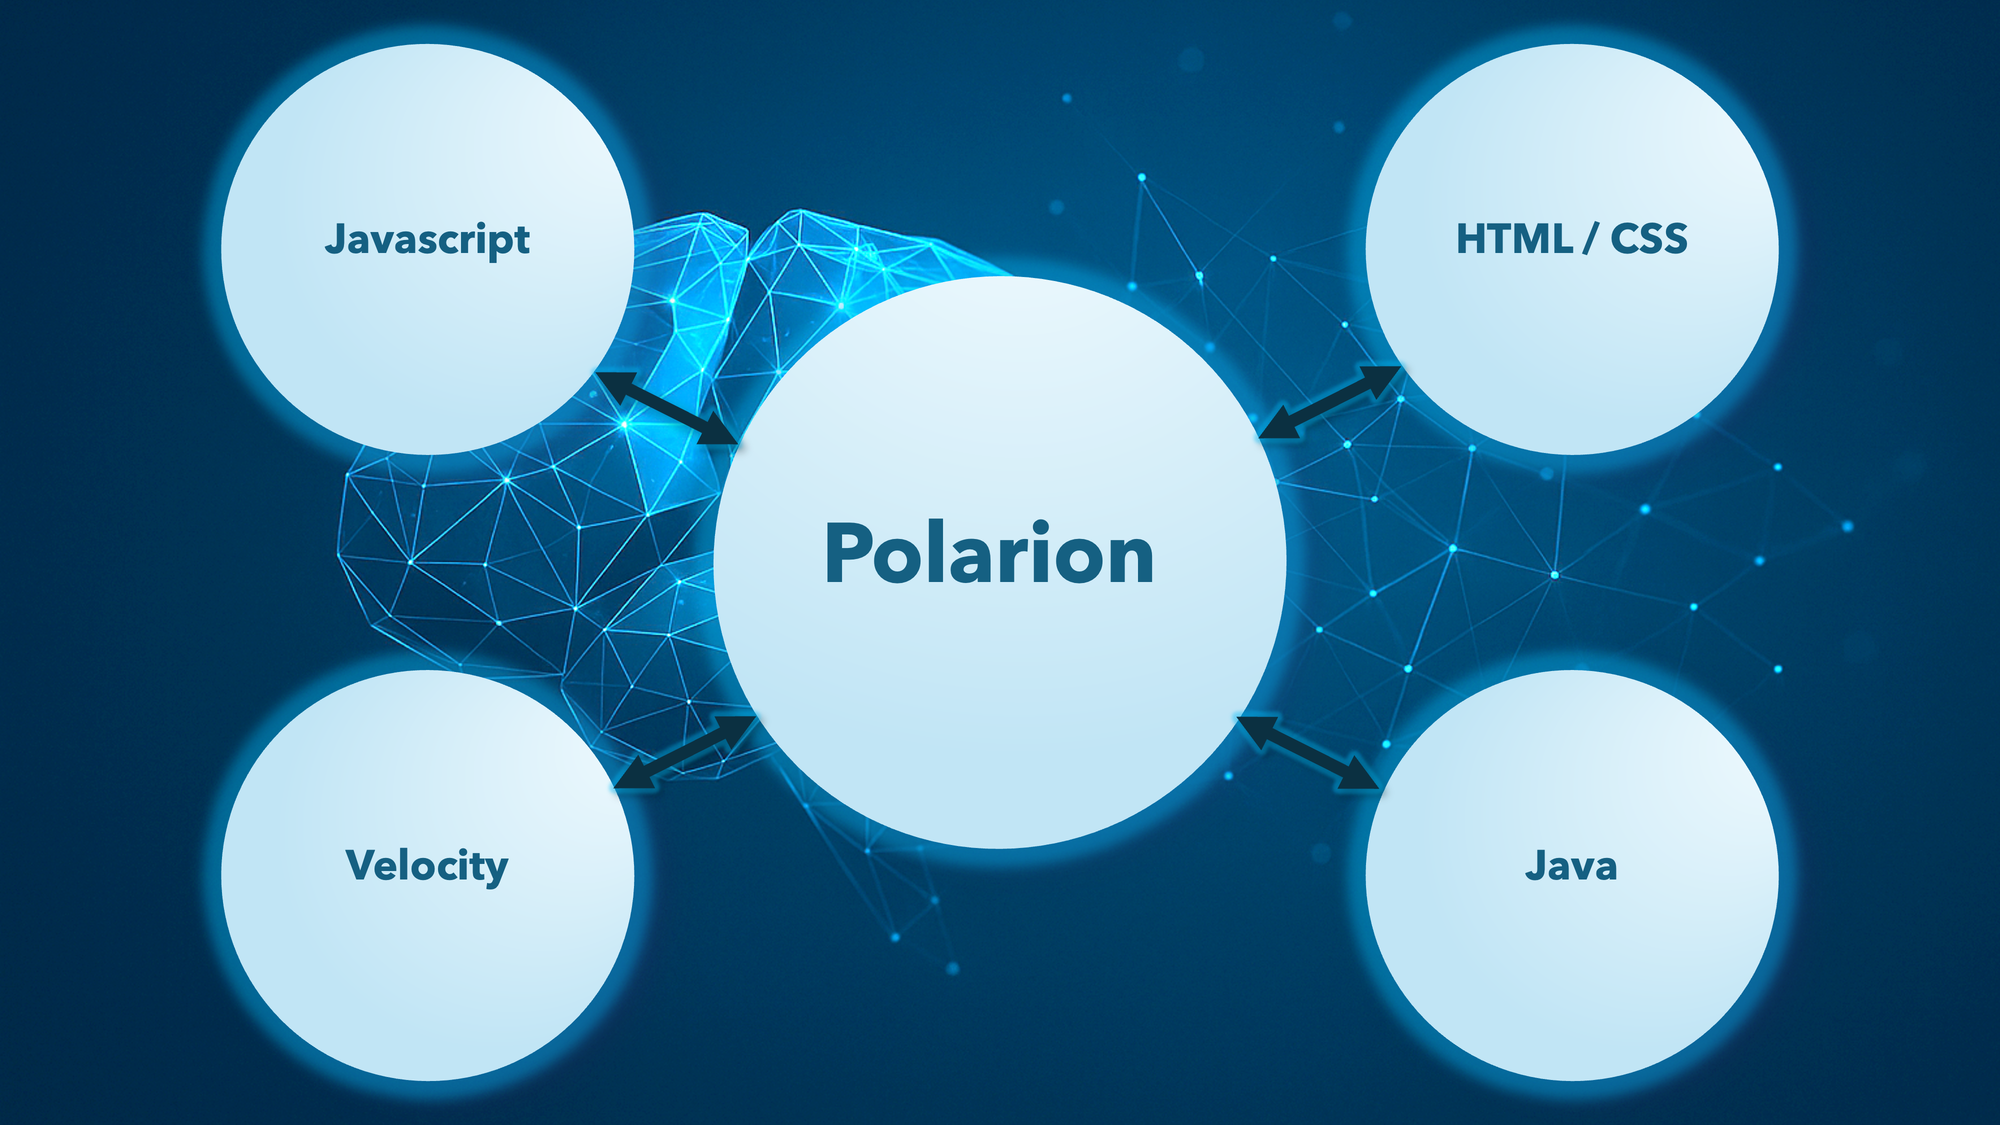
The first three are scripting languages and can be handled in almost any editor. The question there is mostly: What makes me fast? What is ergonomic? What supports my thinking?
Java is different:
- Projects need to be managed properly
- Code has to be compiled
- Debugging inside a running Polarion instance is not optional
On top of that, Polarion adds its own twist:
I want to debug my Java extensions inside running Polarion. That means: Polarion must be started through an IDE so I can set breakpoints and inspect the code in its actual runtime context.
The officially recommended IDE for Polarion is Eclipse. That makes sense technically:
- Eclipse is free
- Polarion is based on Eclipse OSGi plugins
- Extensions are developed as Eclipse plugins
- Documentation and examples are Eclipse-centric
All of that is technically fine – but it’s no longer the setup I want to use day to day.
My Journey: From Eclipse + Notepad++ to “VS Code First”
How I Started
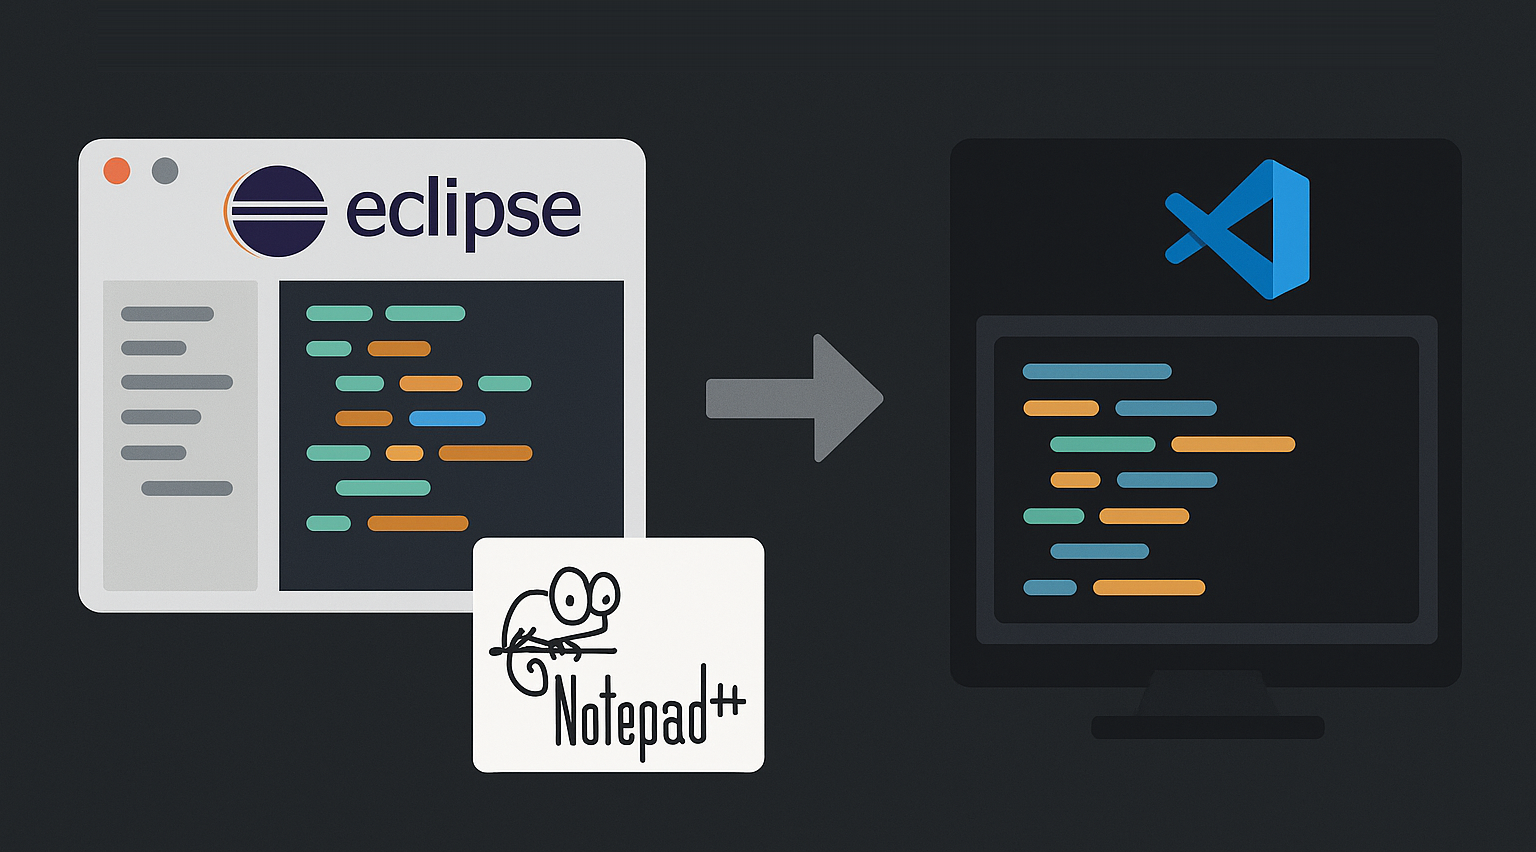
A few years ago my setup looked very classic:
- Eclipse for Java and debugging
- Notepad++ for Velocity and some HTML snippets
At the time, that was simple and pragmatic:
- Notepad++ had usable Velocity formatters
- Eclipse was the default for Polarion debugging
- You could get work done without much overhead
For getting started it was absolutely fine. But it was far from optimal once you care about productivity, automation, and AI support.
Today: VS Code as My Center of Gravity
Today my setup looks very different. I push it as far as possible towards VS Code only:
- Scripting languages (Velocity, JS, HTML, CSS): in VS Code
- Reading and analyzing logs: in VS Code
- File replacements and refactorings: in VS Code
- Java development: almost exclusively in VS Code
I don’t use Notepad++ or any other editors anymore. VS Code can do everything I used to do there – and with intelligent features and AI support it often does it much better.
A simple example:
In the past I did search-and-replace across files in Notepad++, playing with fragile regexes and hoping I wouldn’t break anything.
Today I combine:
- the built-in search in VS Code,
- structured refactoring,
- and, where it makes sense, GitHub Copilot to help me adjust patterns and handle exceptions.
Why I Clearly Prefer VS Code Over Eclipse
Platform, Availability, and Open-Source Base
VS Code is:
- free
- available on all major platforms
- usable in a browser (for example via web-based editor variants)
The underlying codebase (“Code - OSS”) is open source. That’s why you see VS-Code-like editors pop up in many places, especially in the web space. For my daily work it boils down to this: wherever I am, I can get a working environment very quickly.
Performance
In my day-to-day work, VS Code is simply fast and unproblematic.
Over the years Eclipse has regularly annoyed me with sluggish performance – especially when many projects, plugins, and PDE stuff are involved. VS Code feels much lighter, without me feeling like I’m missing any serious capability.
I’m not building rocket guidance software with hundreds of millions of lines of code. For Polarion, web, backends, and the usual extensions, VS Code’s performance is more than enough – and consistently so.
Flexibility and Extensibility
VS Code is extremely flexible:
- it supports practically all programming languages
- it is highly configurable via settings and settings sync
- workspaces and multi-repo setups are first-class citizens, not edge cases
And the crucial point:
If VS Code doesn’t support something out of the box, there is almost always a free extension for it.
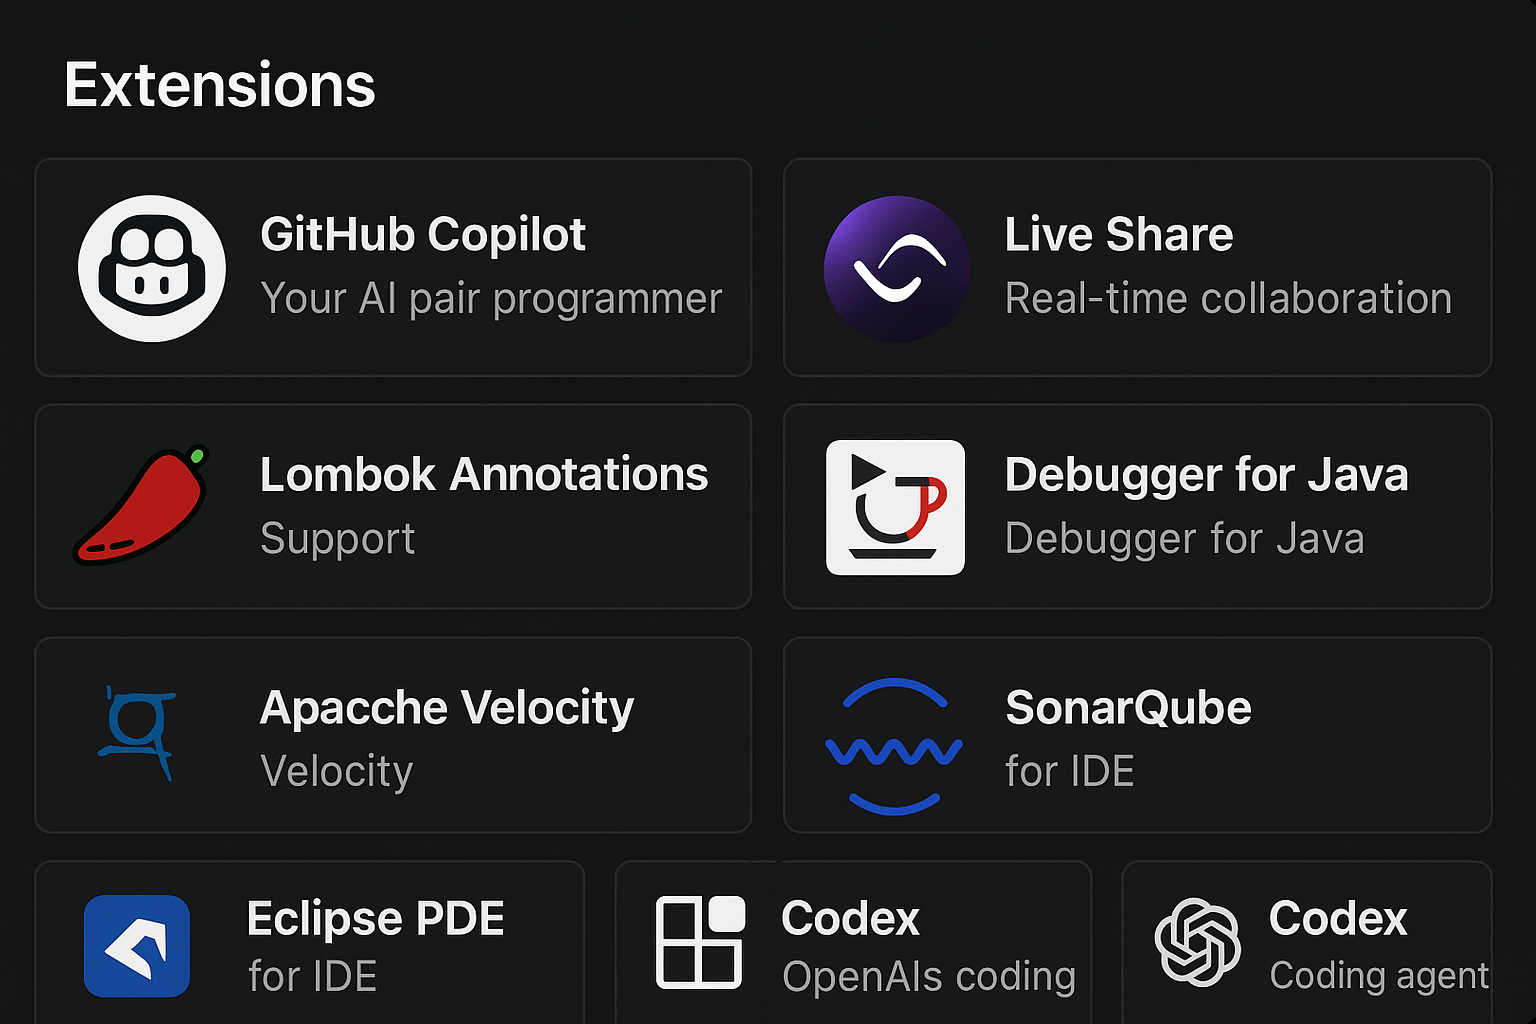
Concrete things I use:
- Velocity formatter
- Java execution, tests, build integration
- AI integrations (Copilot, chat plugins, tools)
- Git and SVN integrations
- Tools for remote development, containers, dev containers, etc.
New tools and AI models usually get VS Code extensions very early. The ecosystem and community move quickly.
Profile Sync, Remote Work, and Liveshare
As a remote worker, one thing matters a lot: consistency.
- With Settings Sync I have the same VS Code setup on every machine and in every VM.
- Themes, keybindings, extensions – everything is synced.
- With Liveshare I can work directly in the same code with colleagues, without screen-sharing, but with full editing rights and visible cursors.
With multiple virtual systems and changing environments this saves time and nerves every single day.
Git, SVN, and Copilot for Commit Messages
Source control also lives inside the IDE:
- Git integration in VS Code is excellent
- SVN can be integrated via extensions
- Diffs, blame, branching, staging – all right in the editor
And I happily use Copilot for commit messages too – not to “let it write something random”, but to get structured, meaningful suggestions that I then review and adjust.
The Downside: Debugging Polarion in VS Code
Now for the uncomfortable part:
As of today, I still cannot debug my Polarion Java code in a fully stable way directly in VS Code.
There are basically two theoretical approaches:
- Attach VS Code to a running Polarion process via JDWP
- Start the Polarion server directly from VS Code (PDE-like approach)
Both are technically possible, but neither is at the point where I’d call it “production-stable” for my daily work.
My Current Setup: Pragmatic, Not “Perfectly Beautiful”
The honest solution I’m using right now looks like this:
- Writing code: in VS Code
- scripting languages
- Java
- tests, refactorings, replacements
- AI support with Copilot and my ChatGPT setup
- Debugging Polarion: in Eclipse
- Polarion runs locally on a Windows development instance
- startup and debugging via classic PDE / launch configurations
- breakpoints, stepping, variable inspection: all in Eclipse
Yes, that sounds like “two worlds”. Objectively, it is. Subjectively, it works well for me:
- I know both environments very well.
- I’m not willing to give up the advantages of VS Code just because Eclipse currently supports Polarion debugging better.
- Eclipse is now a specialized debugger for Polarion in my workflow – not my central IDE.
Concrete Setup: Debugging via JDWP in VS Code
The first approach is the classic one:
Polarion is running, and VS Code attaches to the JVM process via JDWP.
Step 1: Enable JDWP in Polarion
You need to start Polarion with the JVM exposing a debug port. A typical addition to the JVM arguments (using port 5005 as an example) looks like this:
-agentlib:jdwp=transport=dt_socket,server=y,suspend=n,address=5005In short:
- transport=dt_socket – debugging over a TCP socket
- server=y – JVM listens for incoming connections
- suspend=n – application starts immediately and doesn’t wait for the debugger
- address=5005 – port VS Code will later connect to
Where to put the JDWP arguments in Polarion - On a typical Windows installation:
- You have a file like:C:\Polarion\polarion\polarion.ini
- In that file you will see a -vmargs section with existing JVM options, for example:
-vmargs
-Xms1g
-Xmx1g
-XX:+UseG1GC
...- You add the JDWP argument below -vmargs, together with the other options, e.g.:
-vmargs
-Xms1g
-Xmx1g
-XX:+UseG1GC
-XX:+HeapDumpOnOutOfMemoryError
-agentlib:jdwp=transport=dt_socket,server=y,suspend=n,address=5005- If Polarion is installed as a Windows service, you typically need to re-run the service.bat in the same folder (e.g. C:\Polarion\polarion\service.bat) so that the new VM arguments are applied to the service.
Where to put the JDWP arguments in Polarion - On Linux / Unix-like setups:
On Linux, Polarion usually runs as a registered system service (for example via systemctl). The JVM options are typically defined in:
- /opt/polarion/etc/config.sh
A typical config.sh looks like this (shortened to the relevant part):
# JDK run-time option for Polarion server
export PSVN_JServer_opt="-server \
  -Xms3968m \
  -Xmx3968m \
  -XX:+UseG1GC \
  -XX:+HeapDumpOnOutOfMemoryError \
  -XX:-OmitStackTraceInFastThrow \
  -Dosgi.parentClassloader=ext \
  -XX:+UseBiasedLocking \
  -XX:BiasedLockingStartupDelay=0"
To enable JDWP debugging, you extend exactly this PSVN_JServer_opt variable by appending the JDWP agent parameter. For example:
# JDK run-time option for Polarion server
export PSVN_JServer_opt="-server \
  -Xms3968m \
  -Xmx3968m \
  -XX:+UseG1GC \
  -XX:+HeapDumpOnOutOfMemoryError \
  -XX:-OmitStackTraceInFastThrow \
  -Dosgi.parentClassloader=ext \
  -XX:+UseBiasedLocking \
  -XX:BiasedLockingStartupDelay=0 \
  -agentlib:jdwp=transport=dt_socket,server=y,suspend=n,address=5005"
Important details:
- Keep the backslashes (\) at the end of each line, except the last line.
- Make sure you don’t accidentally break the quoting (" around the whole value).
After editing config.sh:
- Restart the Polarion service, e.g.:
sudo service polarion restart- Check the Polarion logs to verify it starts correctly and that no syntax error in config.sh prevents the JVM from starting.
Once this is in place, Polarion will start with JDWP enabled on port 5005, and VS Code can attach to it using your launch.json configuration.
Step 2: Workspace Setup in VS Code
For debugging to make sense:
- The source code of your Polarion plugin must be in the VS Code workspace.
- The structure should match the build/deploy setup as closely as possible.
- The deployed JAR in Polarion must exactly correspond to the source code in VS Code.
If those don’t line up, you’ll end up setting breakpoints in files that don’t match the running code – and nothing will ever hit.
Step 3: Create launch.json
In the project root, create a .vscode folder (if it doesn’t exist yet) and add a launch.json file.
Example:
{
  "version": "0.2.0",
  "configurations": [
    {
      "type": "java",
      "name": "Attach to Polarion (JDWP)",
      "request": "attach",
      "hostName": "localhost",
      "port": 5005
    }
  ]
}
This tells VS Code:
- use the Java debugger
- perform an attach to an already running JVM
- target localhost:5005 (or whatever host and port you have)
Step 4: Running a Debug Session
The typical flow for a debug session is:
- Start Polarion with the JDWP port enabled.
- Open VS Code with the workspace containing your plugin’s Java source.
- Go to “Run and Debug” and select “Attach to Polarion (JDWP)”.
- Start debugging.
- Set breakpoints in the Java code and hit them in the running system.
Why This Is Annoying in Practice
In theory this works. In practice it comes with very real pain:
- Polarion only loads extensions at startup
- Every code change requires: build → deploy JAR → restart Polarion
- No real “live debugging” and only very limited hot swap
You can automate parts of this with Maven and scripts. But you cannot remove the constant restart cycle. For targeted investigations this is acceptable. For a tight development loop it’s too slow and too fragile for my taste.
VS Code Only Debugging: PDE Approach (Work in Progress)
The second approach is more attractive:
Start Polarion directly from VS Code – similar to PDE launches in Eclipse.
Technically, Polarion is based on Eclipse/PDE. VS Code doesn’t understand that world natively, so you need a bridge – for example an extension that can:
- read PDE / target platform configurations
- replicate Polarion’s launch configuration
- start the server with debug options directly from VS Code
One concrete candidate for this is the “Eclipse PDE Support” extension for VS Code: https://marketplace.visualstudio.com/items?itemName=yaozheng.vscode-pde
It is designed to:
- import Eclipse target platforms,
- understand PDE-style launch configurations,
- and make it possible to run and debug PDE-based applications from VS Code.
I’m currently experimenting in exactly this direction.
GitHub Copilot + ChatGPT: The Real Multiplier
One of the main reasons I shifted so hard towards VS Code has nothing to do with file trees or themes. It’s AI support. GitHub Copilot is clearly positioned as an “AI pair programmer”: It doesn’t just autocomplete code, it generates functions, tests, documentation, and helps with refactorings – right inside the editor.
There is a Copilot integration for Eclipse, and it has improved over time. But in my experience the integration in VS Code is still significantly ahead.
In my daily work, Copilot is there for almost everything:
- suggestions for Java, Velocity, JS, HTML, and tests
- generating boilerplate (DTOs, mappings, repeated patterns)
- helping with refactorings (“make this block readable”, “extract reasonable methods”)
- assisting with larger edits across code paths, including edge cases
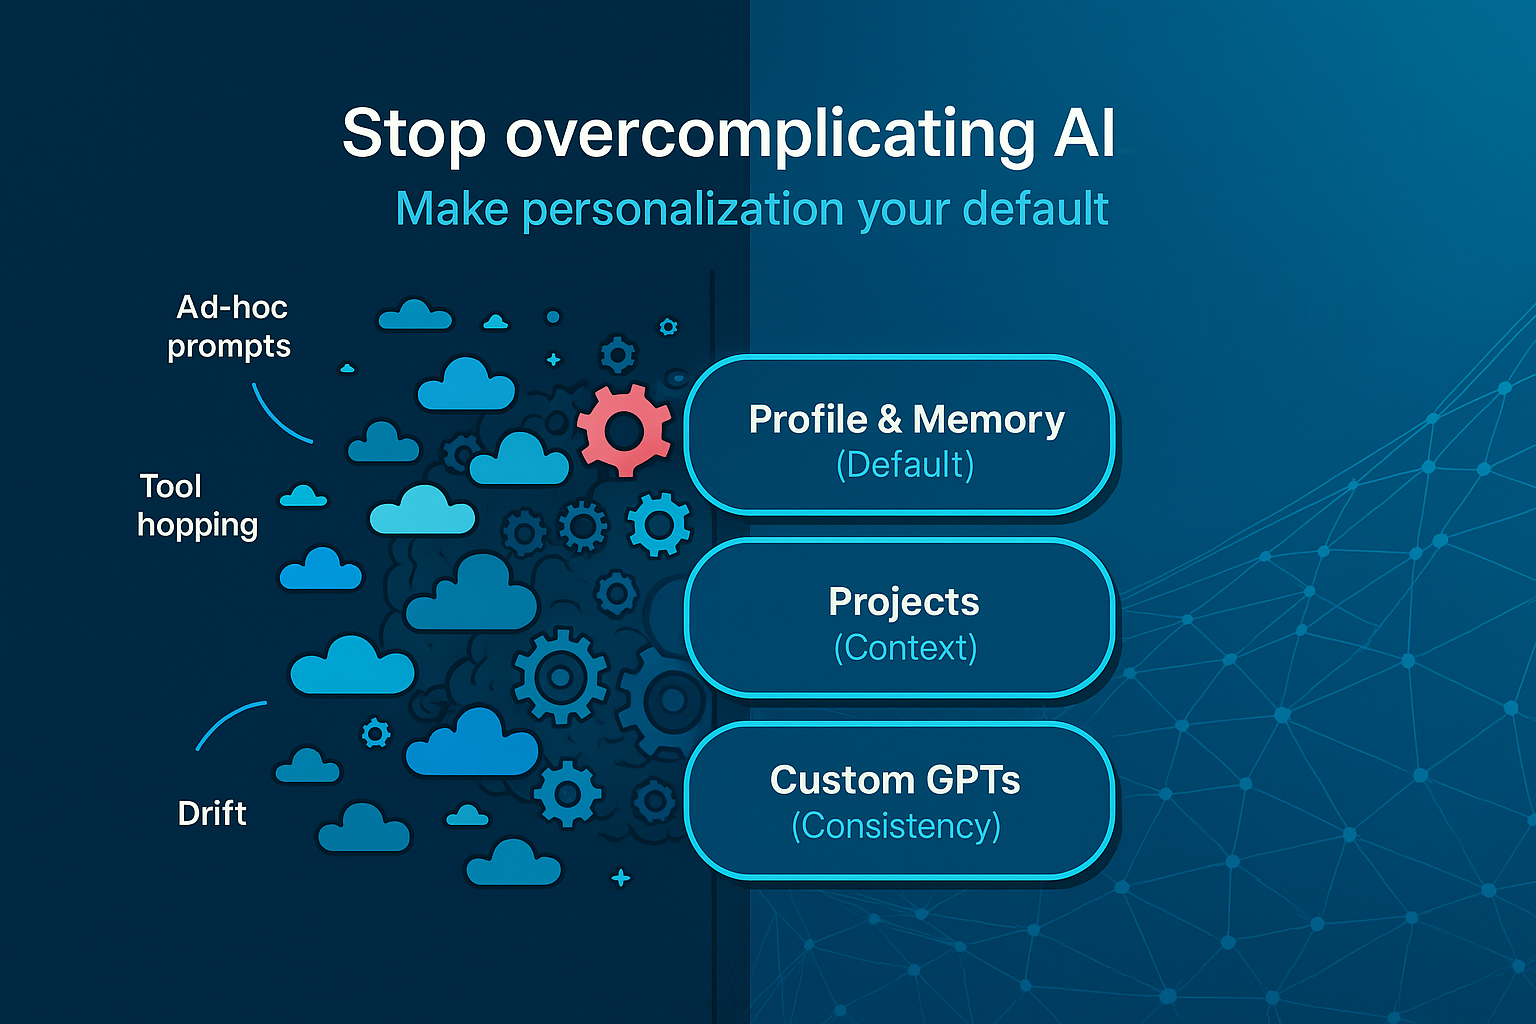
In parallel, I run a desktop version of my personalized ChatGPT. I described that setup in detail here: Stop overcomplicating AI – make personalization your default
I use that ChatGPT setup for:
- for architecture questions
- for prototyping
- for complex refactorings
- for discussing alternatives and design decisions
VS Code is the hub in this setup:
- Copilot is inline, exactly where I type.
- ChatGPT runs next to it as a sparring partner with context about how I like to work.
- Eclipse stays focused on debugging and doesn’t interfere with this flow.
What About AI-Native Editors Like Cursor and Windsurf?
Lately, more and more editors are coming out that position themselves as AI-native IDEs – not “editor with AI plugin”, but “editor built around AI from the start”.
Two prominent examples:
- Cursor – an AI-centric code editor with features like project-wide context, inline edits, multi-file refactorings, and agent-like workflows.
- Windsurf – also an AI-first editor, focusing heavily on agents and deep codebase analysis, pitched as an “AI-native IDE”.
Both have a similar vision:
AI not as an add-on, but as a first-class citizen in the development environment.
They aim to offer things like:
- agents that handle entire workflows
- multi-file refactorings via chat
- automated reasoning over large repositories
Why I Haven’t Switched (Yet)
So far, I haven’t really warmed up to these tools in my own workflow. The main reasons are straightforward:
- they usually mean another monthly subscription,
- and I don’t currently see a clear, concrete advantage over my existing setup (VS Code + Copilot + ChatGPT).
I do think these tools absolutely have their place – especially for teams that want to build their entire way of working around such an AI-first environment and treat the IDE as an orchestrator for agents and automation.
And I also think the general trend will clearly move in that direction:
AI not as a plugin, but built-in from the beginning.
For me personally, right now, it’s not yet compelling enough to justify changing my setup and adding another subscription.
If you have great experiences with Cursor, Windsurf, or another AI-native editor – especially in an enterprise / plugin / platform environment, maybe even with Polarion or something similar – I’d be very interested in a technical exchange. That might well turn into its own follow-up post.
Outlook: The Goal Is Still a Stable VS-Code-Only Setup
My goal is pretty clear:
- do as much as possible in VS Code
- eventually also handle Polarion debugging there
- keep Eclipse only as a fallback for special cases
I’m actively experimenting with the PDE/server-start approach in VS Code. That requires time and focus, and in real projects customer stability and delivery reliability always come first.
If you’re interested in that journey – the steps, pitfalls, and solutions for starting Polarion services directly from VS Code – stay tuned:
- subscribe to the blog
- let me know what topics you care about (VS Code setup for Polarion, debugging, AI workflows, build automation, testing strategy, etc.)
Then I can align future posts with those questions and share my experiences in more detail.